Connect meters and production
Bring utility meters, machine runtime, and output context into one data layer.
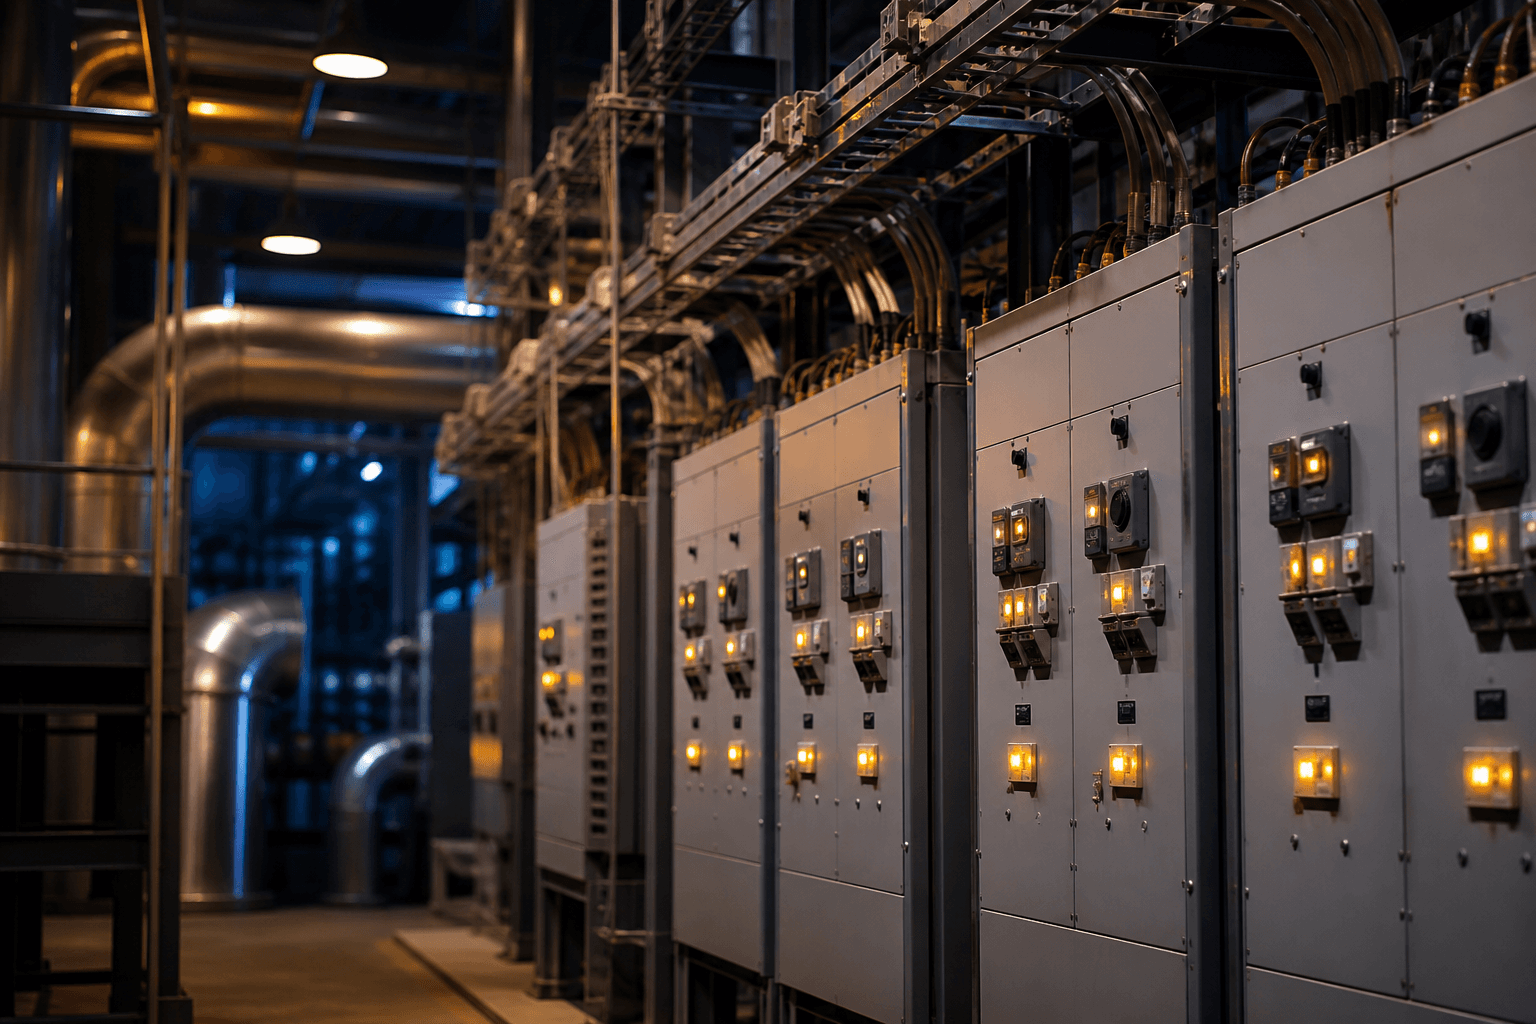
Total bills are visible, but waste, peaks, baselines, and machine-level consumption remain hard to explain.
For plant and utilities teams who see the total — not which machines, lines, or shifts caused it.
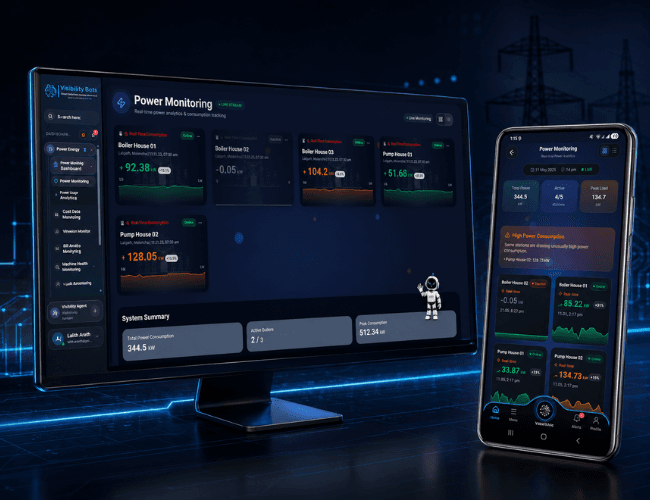
The operational areas this solution brings into one connected view.
Operational measures used to monitor this area. They are not promised outcomes or unverified performance claims.
A practical sequence from connected signals to coordinated follow-up for this solution.
Bring utility meters, machine runtime, and output context into one data layer.
Compare current use against expected patterns by line, shift, and product mix.
Surface abnormal intensity, peak demand, and unexplained variance while it is still actionable.
Neo relates utility behavior to production context so teams know what changed.
Route the next review or action to the owners who can correct the drift.
An illustrative exchange showing how a energy intelligence question can be answered with the context behind it.
Plant ManagerWhy was our energy cost higher last week?
Utility intensity rose on the dyeing line while output stayed flat, and two peak demand events fell outside the usual shift pattern. The same line also ran a heavier product mix than the baseline assumes.
A practical view of what gets connected, how context is built, and what teams can act on.
Neo can explain why utility intensity changed by combining production context, meter behavior, and operating conditions.
Each product contributes a layer of the shared operational record this solution relies on.
Each vertical brings its own operating context, data sources, and evidence expectations.
Textile operations combine production, dyeing, WIP, lots, trolleys, utilities, maintenance, quality, warehouse, buyer compliance, and management reporting.
ExploreFast-moving operations need reliable visibility across production lines, quality, packaging, warehouse, utilities, and dispatch.
ExploreFood and beverage sites need traceable, timely intelligence across production, utilities, quality, safety, and compliance.
ExploreManufacturers need connected visibility across machines, production, maintenance, warehouse movement, quality, and management actions.
ExploreStraight answers on what this capability covers, how it connects, and where teams usually begin.
Know where utilities are consumed, wasted, and drifting before cost becomes tomorrow's surprise.
Visibility Live share one operational record, so signals, evidence, and follow-up stay connected instead of living in separate tools.
No. KPIs are listed as operational measures to track, not as promised outcomes or unverified performance claims.
Yes. Most implementations begin with one high-value signal or workflow and expand as the shared record grows.
Connect your existing systems — including SCADA and PLC feeds where they already run — with Visibility Bots.
Tell us which operations, SCADA or PLC feeds, documents, or workflows you want to connect first.