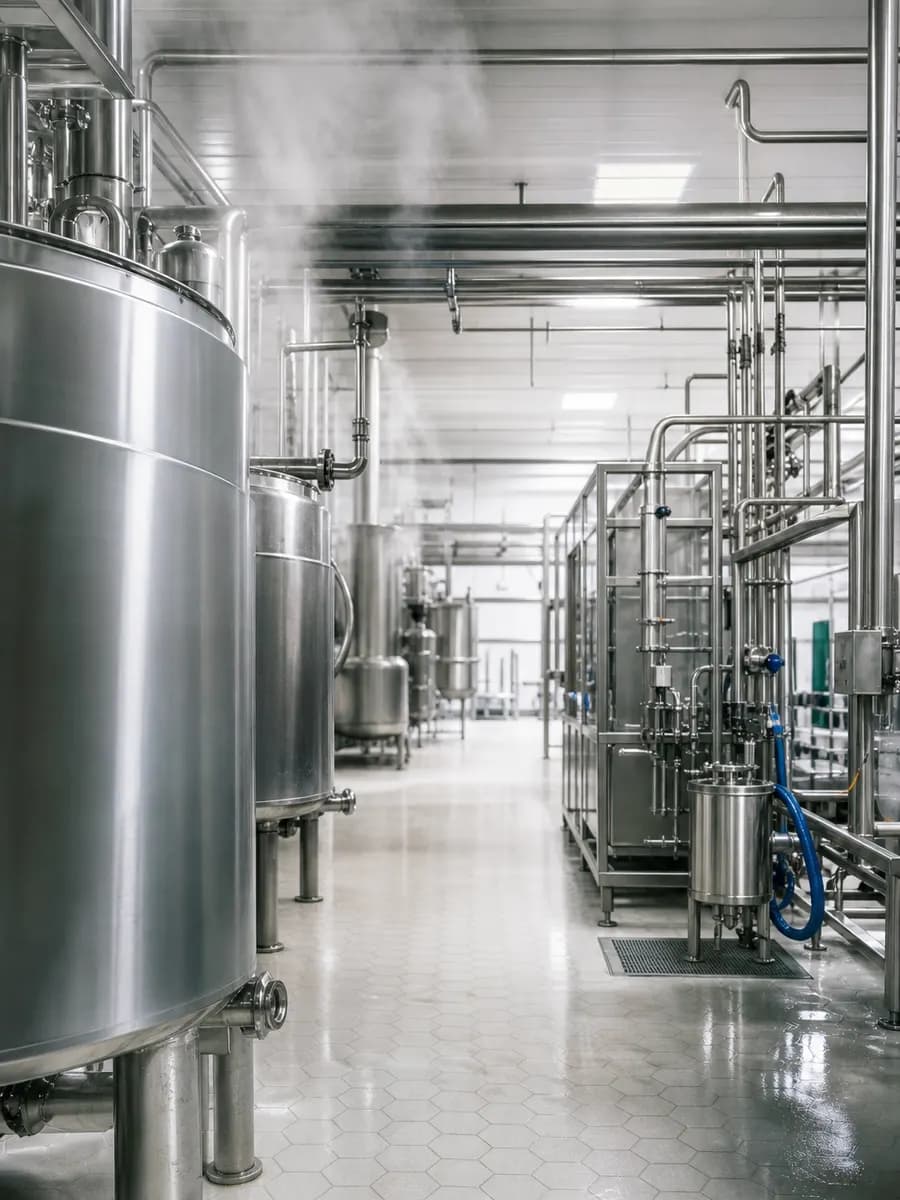
Batch records, line status, production counts, downtime, utility context
Production variance can be reviewed with the operational signals that explain it.
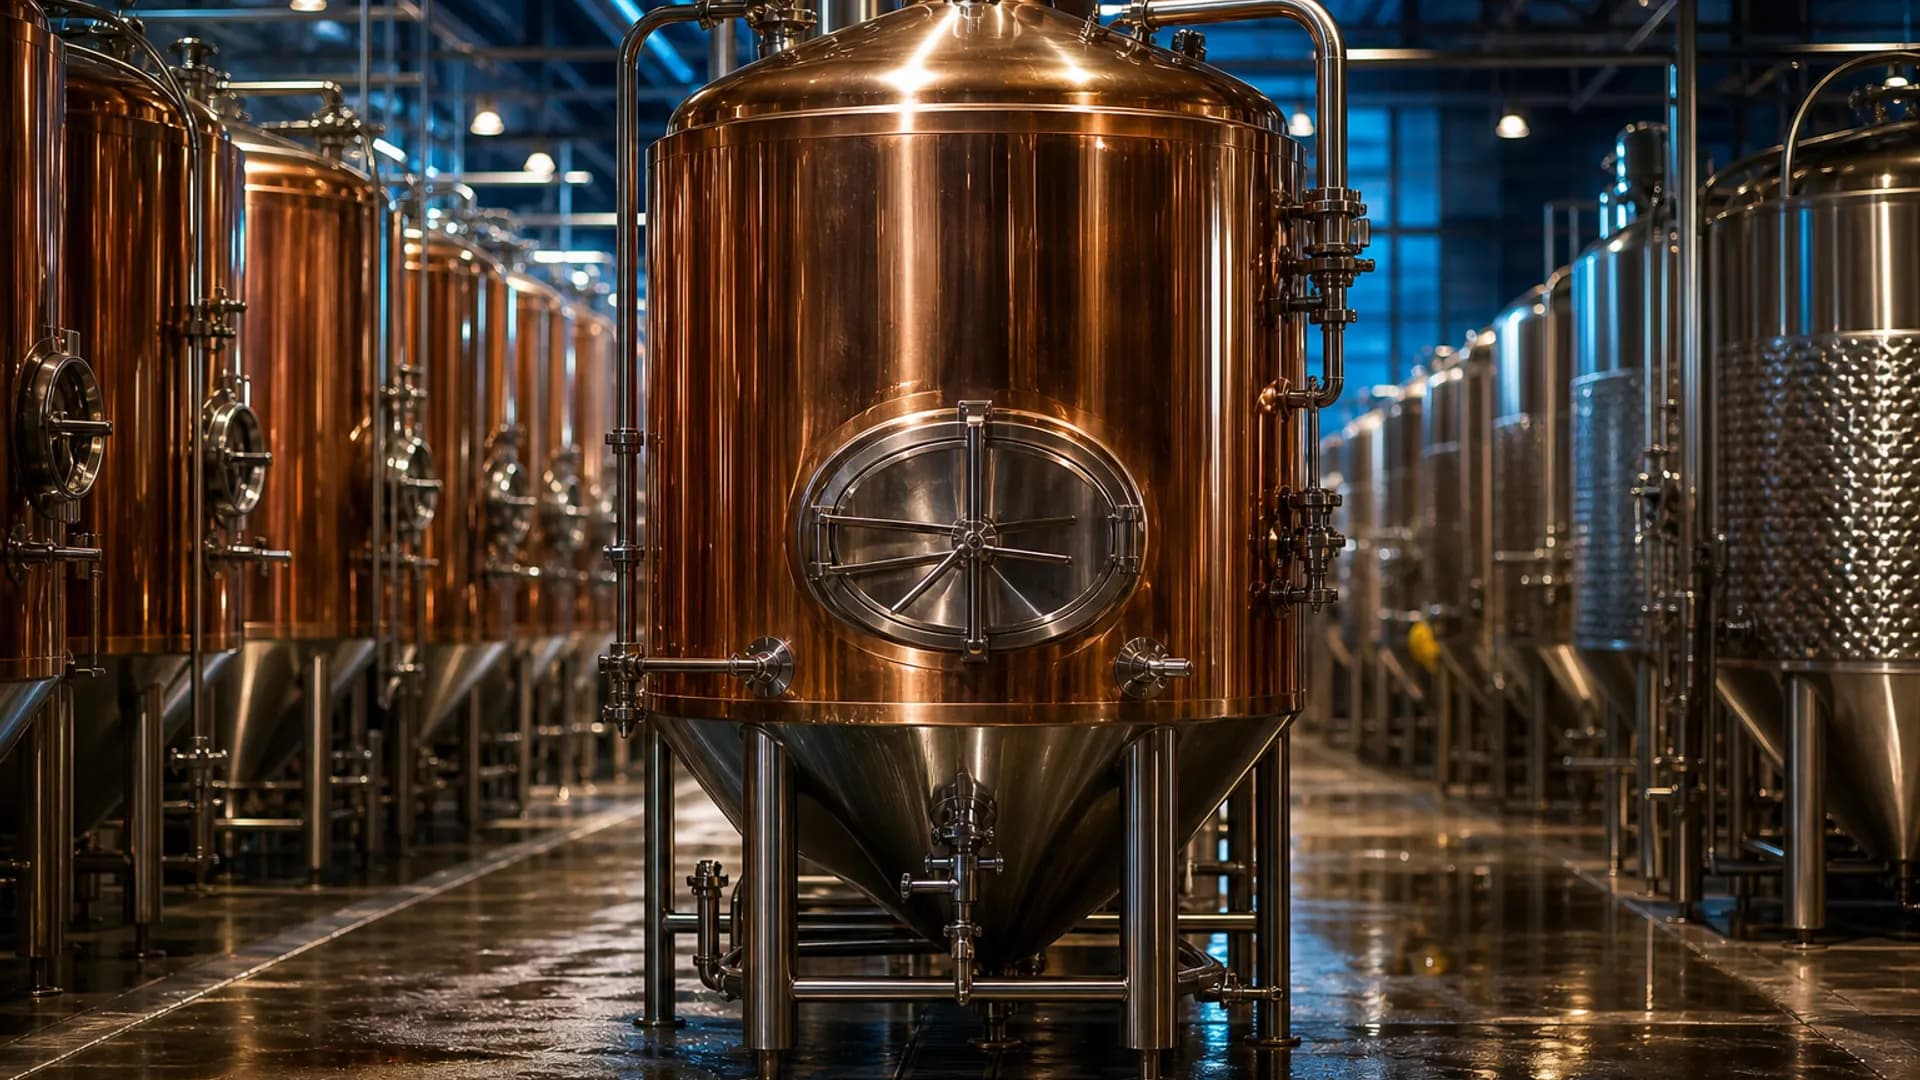
Food and beverage sites need traceable, timely intelligence across production, utilities, quality, safety, and compliance.
Production lines, Batch records, Utilities, Cameras, SOPs, Audit records.
Production variance can be reviewed with the operational signals that explain it.
Inspection and visual evidence can support disciplined review without unsupported compliance claims.
Utility and equipment issues can be connected to operational impact and follow-up work.
Quality holds and release blockers stay visible with the batch and people who must clear them.
Three lanes on the same operating record — what fails when signals stay siloed, where teams begin, and how Neo prioritizes the next action.
Batch cost, quality holds, and utility spikes get reviewed too late — without the batch context that explains them.
Food and beverage sites usually start with batch and line visibility or utility monitoring, then connect quality evidence, safety checks, and corrective actions.
Neo can relate batch variance, utility cost, and inspection findings so teams see what changed and what needs follow-up.
Pick one high-value wedge. Expand across the shared record once that loop is useful day to day.
Until then, use anonymous structures on Customers and walk your site map in a scoped demo — no fictional logos or unverified outcomes.
A food and beverage site can begin with batch and utility visibility or inspection evidence, then connect safety checks and corrective actions into one operating loop.
Batch timing, yield, and downtime need the same view as production counts.
Camera and inspection events become searchable evidence for process and safety review.
Energy and water variance must stay linked to the process stages that consumed them.
Findings and holds only help if ownership and due dates stay attached.
A practical sequence from connected signals to coordinated follow-up for this industry.
Bring batch records, line status, and utility meters into one production context.
Link camera events, SOPs, inspections, and corrective actions to the process they cover.
Surface timing, yield, and utility drift while the batch can still be corrected.
Neo connects utility cost, batch variance, and open findings into a practical summary.
Assign maintenance, quality, or compliance follow-up with the evidence attached.
An illustrative exchange showing how a Food & Beverage operations question can be answered with the context behind it.
Operations LeadWhy did yesterday's batch cost more than usual?
Utility use rose while the batch ran longer than planned, and a quality check delayed release into the next stage. The same line has shown similar timing variance twice this week.
Operational measures used to monitor this industry. They are not promised outcomes or unverified performance claims.
Outcome-focused starting points that map to this industry's operating context.
Know where utilities are consumed, wasted, and drifting before cost becomes tomorrow's surprise.
ExploreSee throughput, bottlenecks, downtime, and variance while production is still recoverable, using line and machine signals from the systems you already trust — including SCADA and PLC context.
ExploreConnect condition and runtime signals — from meters, sensors, or existing SCADA and PLC paths — to SOPs, work orders, and recommendations instead of inventing a second control room.
ExploreConvert visual events into evidence, alerts, and operational context.
ExploreThe product layers that typically connect into this industry's operating map.

Real-time industrial operations intelligence that sits beside existing PLC and SCADA systems
Explore
Computer Vision Intelligence for Industrial Operations
Explore
Enterprise Knowledge Intelligence
Explore
Audit & Compliance Intelligence
ExploreStraight answers on what this capability covers, how it connects, and where teams usually begin.
Food and beverage sites usually start with batch and line visibility or utility monitoring, then connect quality evidence, safety checks, and corrective actions.
Visibility Live, Visibility Vision, Visibility Docs and Visibility Compliance share one operational record across the Food & Beverage operating map, so signals, evidence, and follow-up stay connected.
No. KPIs are listed as operational measures to track, not as promised outcomes or unverified performance claims.
Yes. The platform is designed to connect existing operational systems — including SCADA, PLC, MES, and ERP where they already run — and add intelligence where needed, without replacing everything that already runs.
Connect your existing systems — including SCADA and PLC feeds where they already run — with Visibility Bots.
Tell us which operations, SCADA or PLC feeds, documents, or workflows you want to connect first.